
Describing Bar Charts and Column Charts (2)
How to understand and describe multiple comparisons
Observe the following chart:
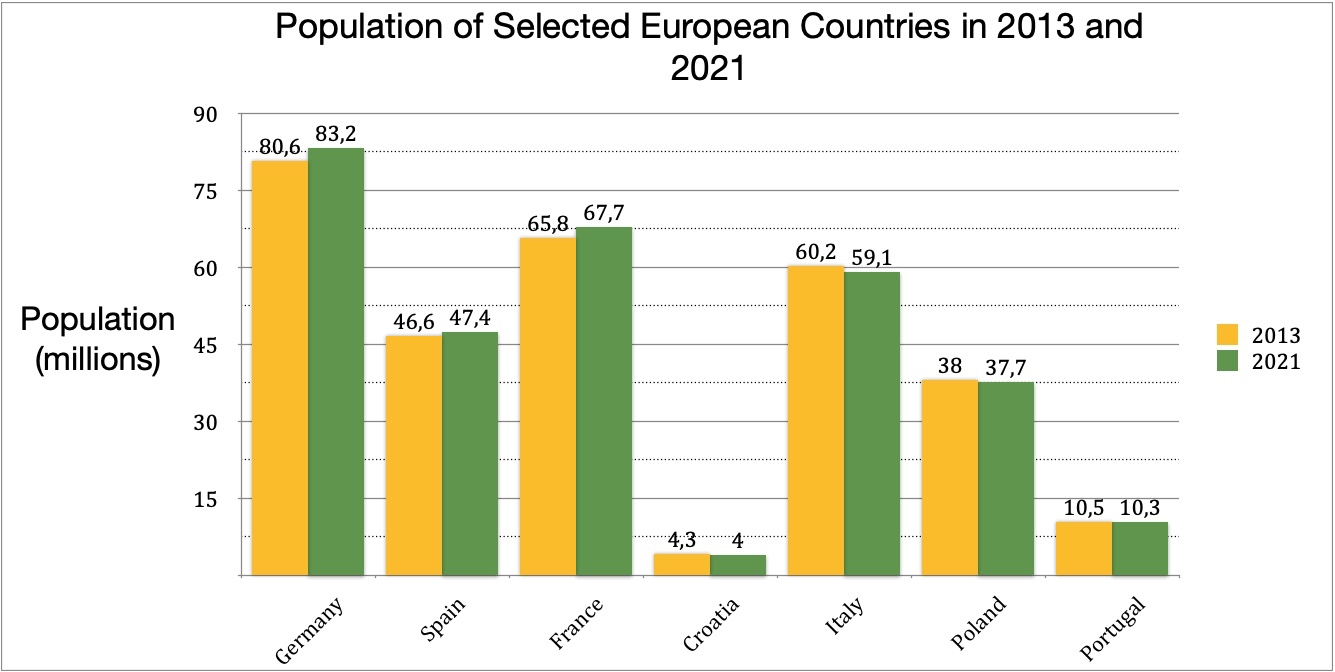
It shows the populations of major European countries in the years 2013 and 2021. In this case we can make two sets of comparisons. We can look at the change in population from 2013 to 2021 for each country, and we can compare the populations of the various countries in each year.
In general, when describing a chart of this type, you should describe the most important change first. Then you can compare individual items (in this case, countries).
The most important information on this chart is that in Germany, Spain and France, the population increased from 2013 to 2021, whereas in all the others the population decreased.
Now you can compare individual countries and you can compare two things: You can compare sizes of populations and you can compare the change in populations from 2013 to 2021. We'll concentrate on the change in population.
You can compare the largest change and the smallest change: The largest change was in Germany, where the population rose from 80.6 to 83.2 million, whereas the smallest change was in Portugal where the population of 10.5 million declined by 200,000.
It is important to mention any exceptions to the changes you describe. In this case, the you could point out that of the four largest countries, Italy was the only one where the population decreased in this period.
To write a short description of this bar chart ask yourself (and answer!) the following questions:
- What exactly does the chart show? (Use the chart title to help you answer this question)
- What are the axes and what are the units?
- What changes are there?
- What similarities are there?
- Is it possible to put some of the columns into one or more groups?
- What exceptions are there?
Answering these questions will help you to write a short description of this simple column chart. For example:
This chart shows the populations of seven European countries in 2013 and 2021. In three countries, Germany, Spain, and France, the population rose in this period. The largest rise was in Germany where the population increased from 80.6 to 83.2 million (a 3.2% increase), whereas the smallest increase was in Portugal where the population of 10.5 million declined by 200 thousand. Of the four largest countries, Italy was the only country whose population declined (from 60.2 to 59.1 million). As you might expect, the smallest countries (Croatia and Portugal) had the smallest variation in population (although in terms of percentage change Croatia had the largest variation: a 7% reduction in its population from 2013 to 2021).
Vocabulary
You can see that where there is a change over time, you need to use some of the vocabulary used to describe line graphs (rose, increased, decreased, etc).